A Model for Math Success
Dr. Garret Hall investigates ways to improve math assessment.

Dr. Garret Hall investigates ways to improve math assessment.
Solve the following questions:
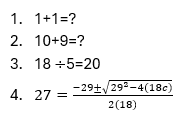
For those who humored this impromptu assignment, you might have noticed a sudden ramp-up in difficulty, and unless you typically use the quadratic formula, you probably struggled a bit more on the last question. Maybe you didn’t attempt to solve it at all, or maybe you mentally jotted down a random answer for c. Regardless, you probably got it wrong, and that’s okay! From a teaching perspective, a wrong answer is simply a data point to identify gaps in knowledge and what material needs to be taught or revisited.
However, Dr. Garret Hall wants to go deeper and provide more information to educators and evaluators. Hall, an assistant professor in the School Psychology Program and the Combined Counseling and School Psychology program, has spent his career exploring how students develop their academic skills, especially in the field of mathematics. Hall believes that applying novel statistical methods to math assessment can open up a whole new level of understanding of the way that students approach math problems.
Using the examples above, math clearly encompasses a wide range of concepts and difficulty. After all, it’s expected that everyone except for the youngest students should be able to figure out the answer to 1+1. However, solving the quadratic formula requires a great deal more prior knowledge, from arithmetic to order of operations. By the time students learn quadratic equations, educators hope they can quickly and accurately solve simpler problems. Traditional evaluation, like a test, might weigh those math problems differently to factor in their difficulty—on a test, 1+1 might have a point value of 1, whereas the quadratic formula might be worth 10 points, for instance—but how should those points be determined?
 “That’s a decision that’s kind of made ahead of time,” said Hall. “And then it’s kind of an assumption. Like, “Oh yeah, we think this problem is twice as hard or worth twice as many points as the other, so then it’s weighted more in the overall score.’”
Hall, however, thinks there is a better way. Using students’ response time in answering math problems, teachers and evaluators can better understand students’ response processes and eventually make testing more reliable and valid. Psychometrics is the field of evaluating the reliability and validity of psychological assessments, and while the concept is far from new, Hall is taking more advanced psychometric methods and applying them in a much more practical context.
Hall wants to measure latent ability, which is not an easy thing to do. Latent ability in this context refers to the ability that an assessment is intended to measure, but that ability is not directly observable. The probability that a person will correctly solve a simple math calculation problem is assumed to be caused by the person’s latent math ability, but we only observe the actual answer they give. “Theoretically, we don’t directly observe math calculation fluency,” he said. “We give a measure, and we get a score, and whether we calculate that score by hand or we do fancy statistics like I’m doing, either way we’re saying this score is coming from an ability that we did not directly measure.”
The problem, Hall says, is that trying to figure out this ability score requires a lot of assumptions. Just because one child scored better or worse on a test compared to her peers might not necessarily indicate her ability. “My argument is that when you calculate the score by hand using a paper and pencil measure, that’s an even rougher proxy for ability than if we capture response time and accuracy together.”
In Hall’s mind, there is a difference between being fast and wrong on some math problems and slow and accurate on other problems. While there are plenty of models that evaluate speed and accuracy of performance, Hall is specifically looking at applying the drift diffusion item response theory model.
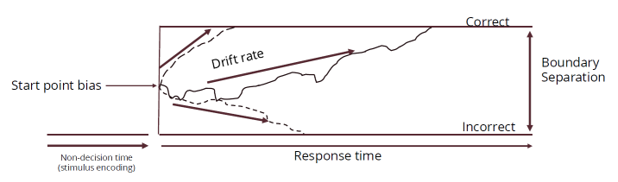
Hall explains the basics of the model. “You're sitting at a computer, and a calculation problem pops on the screen. There's a very brief time in which you're encoding the stimulus and you're recognizing like, ‘Oh yeah, that's 17 x 32.’ That time between it popping up on the screen and you recognizing it is called the non-decision time. Once you recognize it, then you start to execute a decision on what that problem solution is or the product of that particular problem.”
The model illustrates the differences in problem difficulty with the concept of boundaries. The upper boundary represents the correct answer, while the lower is the incorrect answer. An easy question like 1+1 might have little space between the boundaries because it takes very little time for a person to know (or not know) the answer. More complicated problems may have wider boundaries as learners figure out how to solve the problem and come to the correct solution, and those who quickly reach the correct answer might have very high math calculation fluency compared to those who did not answer correctly.
In many ways, Hall is challenging longstanding standards of math assessment: there is more to being right and wrong. As such, he understands the skepticism of needing more data and more information. The potential contribution of this project, he says, is that math teachers understand the patterns of results they get on specific types of math problems.
“I think that’s really what’s helpful to teachers,” Hall said. “A teacher could implement a worksheet, score all these themselves, and realize, ‘Wow, students are really having trouble on this type of problem,’ but many factors could have contributed to them getting the problem wrong. Some students might have just breezed over the problem because they don’t understand, filled in an answer, and moved on. Other kids might have deliberated on it for a disproportionate amount of time. Those are two very different ways of getting the wrong answer, but we don't capture those differences.”
Eventually, he hopes that these more advanced assessment models can shed insight into larger trends, such as certain problems being more difficult for particular grade levels than others. He also hopes that the statistics-supported model can better inform evaluation concepts like weighting point values.
At the end of the day, though, Hall hopes that his research supports students and teachers. “Through all of this fancy statistical stuff, we are really trying to get better qualitative information about the items and how kids are performing on them.” If all of this seems complicated—as complicated as solving a quadratic formula—then let the takeaway be this: better data to help educators do their job better.